
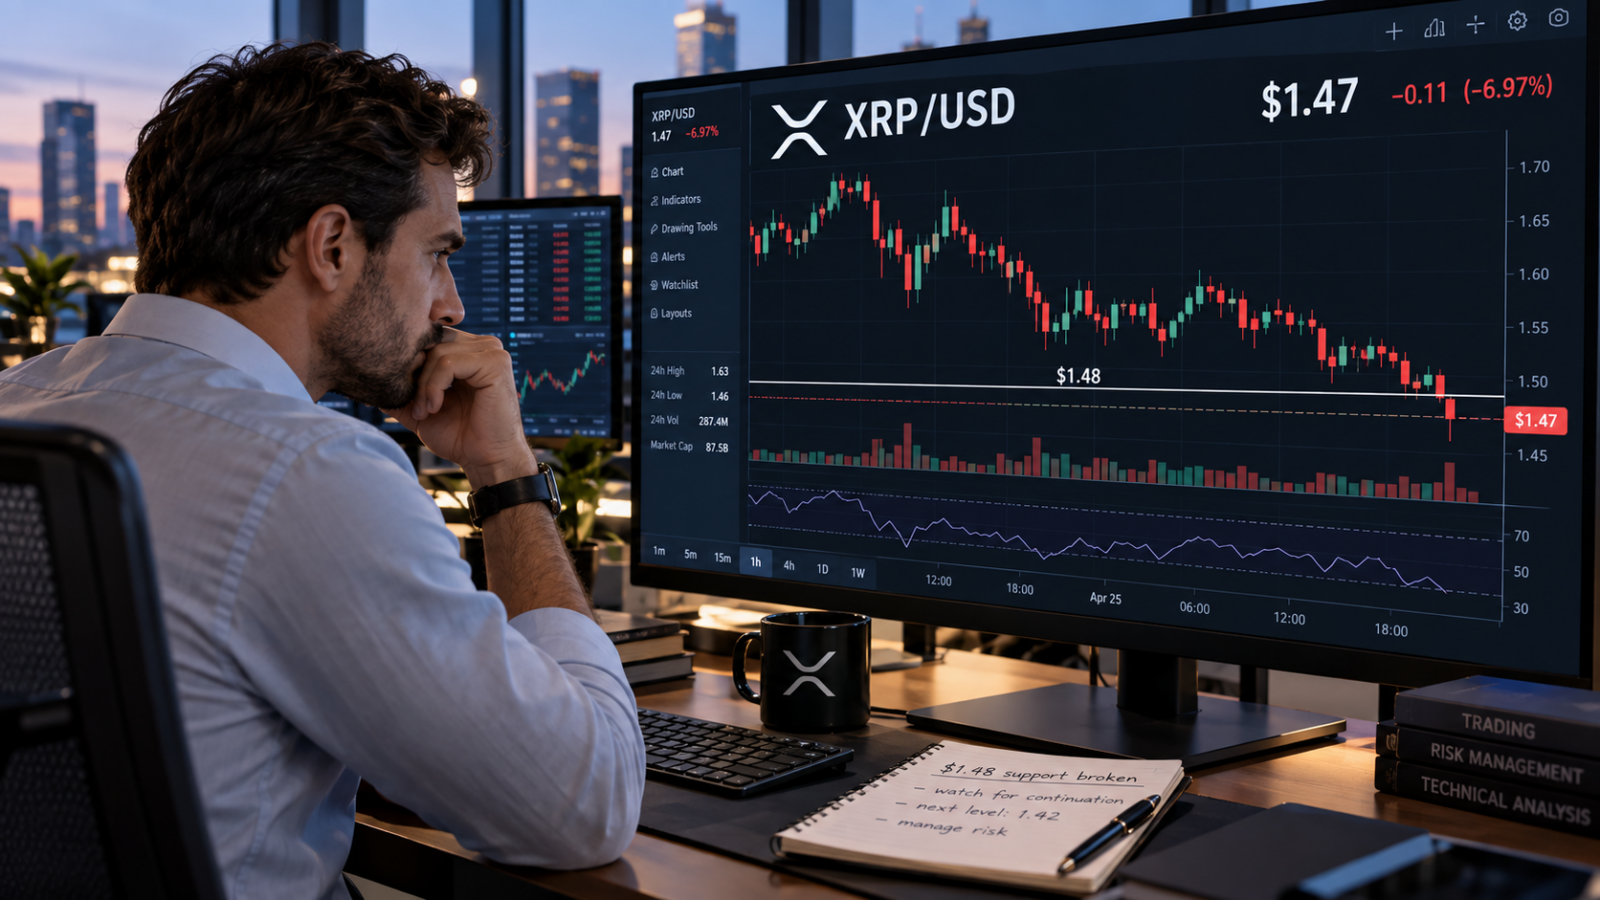
XRP remains under pressure on Tuesday as traders struggle to extend their recent gains. XRP slipped below $1.48 following three consecutive daily declines.
Derivatives positioning and on-chain indicators offered mixed signals, suggesting that XRP had not secured a convincing return to upward momentum.
Derivatives traders send conflicting signals
According to CoinGlass data, XRP’s long-to-short ratio stands at 0.974 on Tuesday. A reading below one means short positions slightly outnumbered long positions in that measure, though the narrow margin points to limited conviction.
Long-to-short ratios can vary depending on which accounts or exchanges are measured, so they should be considered alongside other market data rather than as a complete view of positioning.
Funding rates told a somewhat different story. XRP’s rate was positive at 0.0062%. Positive funding generally means traders holding long perpetual-futures positions are paying those holding shorts.
It indicates demand for long exposure, but can also make a market vulnerable if prices fall and leveraged longs close their positions.
The combination leaves a nuanced picture: XRP positioning is close to balanced, with no clear directional bias at the moment.
Data obtained from the CryptoQuant summary shows flagged overheating conditions in XRP’s spot and futures markets, alongside sell-side dominance in futures.
Such readings suggest trading activity may be stretched while futures sellers retain influence.
These indicators help explain why positive funding has yet to translate into a sustained recovery.
Traders may still be willing to hold bullish positions, but the market needs enough buying demand to absorb selling and push through nearby resistance.
Long-term holder (LTH) supply typically oscillates between periods of net buying and selling.
During the beginning of bull markets, and typically during uptrends more broadly, LTH buying peaks aggressively in the intermediate ranges after a significant breakout, before the uptrend continues higher.
XRP holds above longer-term moving averages
The XRP/USD daily chart remains bullish as XRP is trading around $1.4771 on Tuesday. Despite the three-day decline, it remained above its 50-day exponential moving average near $1.365 and 200-day EMA near $1.369.
The 100-day EMA near $1.307 provided another reference point below the current price.
Momentum had cooled. The relative strength index was near 55, close to neutral, while the MACD had flattened around zero.
Together, those readings suggest a market consolidating after its earlier advance rather than one showing a strong immediate breakout.
The first significant support area lies around $1.37, where the 50-day and 200-day EMAs converge.
A sustained move below that zone would bring the $1.300 area into view.
If the bearish trend persists, the $1.0 psychological level provides a deeper demand zone, although XRP would need to fall substantially before it becomes the immediate focus.
On the upside, $1.574 is the first resistance level.
Reclaiming it would strengthen the case for a move toward $1.90, while another rejection would leave XRP exposed to further consolidation or a test of its moving averages.
The post XRP traders are still bullish while price keeps falling: here’s why that is a problem appeared first on Invezz