
ASTS stock price prediction, set against the last Nasdaq regular-session close, is a $96 bull case and a $44 bear case. AST SpaceMobile finished September 30, 2026 at $58.86. The session ranged from $58.74 to $62.98, against a prior close of $59.40. The bull case is 63.1% above that print. The bear case is 25.2% below it. The condition that decides which side is open is launch throughput into early 2027, not the cash balance and not the July convertible. Management wants about 45 BlueBird satellites up before continuous service in the United States, Europe, and Japan. On August 10 it counted 13 spacecraft in orbit, and BlueBirds 14, 15, and 16 had not flown. A gap of 32 satellites in about six months is a flight-rate problem. Pro forma cash above $3.7 billion does not close it, and the new notes convert only if the stock clears $149.20. This is not investment advice.
The scarce asset is a ride, not a dollar
AST SpaceMobile is still discussed as a company that might run out of money before the network exists. The filings describe a different constraint.
At June 30, 2026, cash and cash equivalents were $2.29 billion, and restricted cash brought the total to $2.72 billion. In July the company raised $1.15 billion of gross proceeds from 1.625% convertible notes due 2034. The August 10 business update put pro forma cash, cash equivalents, and restricted cash above $3.7 billion. Management said the effective conversion price is $149.20. Divide $1.15 billion by $149.20 and the result is 7.71 million shares, 1.98% of the 389,167,494 fully exchanged shares used below.
The dilution that has already landed is in the common stock. Class A shares rose from 285,449,911 on December 31, 2025 to 299,731,073 on June 30, 2026, up 5.0%. First-half proceeds from issuing common stock were $85.7 million, beside share-settled repurchases of the 2032 converts and an $88.7 million induced-conversion expense. Older paper was retired with stock. The new notes dilute only above $149.20.
As of August 6, 2026 the quarterly report counts 299,789,305 Class A shares, 11,215,111 Class B shares, and 78,163,078 Class C shares. Added together, that is 389,167,494, the same 389.17 million StockAnalysis reports. Class A alone at the September 30 close is $17.65 billion. At $58.86 the fully exchanged equity value, which is the count this note uses, is $22.91 billion. June cash of $2.72 billion is $7.00 a share on that count. Pro forma cash above $3.7 billion is about $9.51. The rest of the $58.86 is a network that does not yet charge subscribers.
Purchases of property and equipment were $859 million in the first half, and cash used in operations was $145 million. Second-quarter revenue was $31.5 million and first-half revenue was $46.3 million, against a full-year guide of $150 million to $200 million. Operating expenses were $329.1 million, including a $125.9 million involuntary-conversion loss. Adjusted operating expenses were $119.1 million. Net loss attributable to common stockholders was $230.9 million, or $0.77 a share. Most of the GAAP loss was the charge for a lost satellite, and the revenue beside it was gateways and government milestones.
Key facts at the September 30 close
- Close. $58.86 on September 30, 2026, the Nasdaq regular session, on volume of 11,902,210 shares. Prior close $59.40. Session range $58.74 to $62.98. Nasdaq’s historical series is the source for every daily close here. StockAnalysis, MarketWatch, and Morningstar print the same $58.86. A Stooq file was not available on October 1.
- The path. December 31, 2025 closed at $72.63, so the shares are down 19.0% year to date. September 30, 2025 closed at $49.08, so they are up 19.9% over the chart year. May 28, 2026 closed at $133.09 and traded as high as $133.86. The latest close is 55.8% under that closing high and 56.0% under that intraday high.
- Bull and bear. $96 and $44, not a street average. The Markets Daily, citing MarketBeat on September 24, put the one-year average at $86.58 across 13 analysts, high $108, low $50.80, consensus Hold. StockAnalysis, on a page showing this same close, put the average at $79.61 across 14 analysts, also Hold.
What is actually in orbit
BlueBirds 1 through 5 launched on September 12, 2024. AST’s timeline describes arrays of nearly 700 square feet. BlueBird 7 flew on New Glenn from Space Launch Complex 36 on April 19, 2026 and was deorbited. Spaceflight Now, citing the SEC filing, said it separated and powered on too low for its thrusters, and that AST estimated carrying value at $155 million to $160 million. The quarter booked a $125.9 million involuntary-conversion loss. First-half cash flow shows $21.6 million of insurance proceeds. NASASpaceFlight called BlueBird 7 the second Block 2 satellite, so BlueBird 6 was already up.
On June 17, 2026 a Falcon 9 lifted BlueBirds 8, 9, and 10 from Space Launch Complex 40. SpaceX’s mission page records deployment of all three. On August 5 another Falcon 9 lifted BlueBirds 11, 12, and 13 from the same complex. AST’s verified account posted the launch that morning. On July 31 the same account said those three were stacked for August 5, that BlueBirds 14, 15, and 16 would follow, and that production was through BlueBird 42.
Abel Avellan, chairman and chief executive, said in the August 10 update: “Following the recent orbital launch of BlueBirds 11, 12, and 13, our space-based cellular broadband network has now grown to 13 spacecraft in orbit, each the largest ever in low Earth orbit, with approximately 20,000 square feet of combined aperture hardware deployed.” He said BlueBirds 14, 15, and 16 were getting ready to ship, production ran through BlueBird 46, and AST was preparing beta service with select partners.
Five Block 1 arrays near 700 square feet and seven Block 2 arrays near 2,400 square feet come to about 20,300, in line with the company’s “approximately 20,000” if the operating birds are 1 through 6 and 8 through 13. That is twelve, after BlueBird 7 was lost. AST said 13 spacecraft and published no bird-by-bird list. This note uses 13 as the company count and twelve as the dated count. Beta preparation had reached 3,000 digital cells in the continental United States, a test grid rather than national service. The company also says Block 2 peak rates approach 200 megabits a second.
Scott Wisniewski, president, set the commercial bar on the August 10 call, in the Motley Fool transcript: “You’ve seen our comments on beta, getting that out the door to demonstrate scaled capabilities and then start rolling out commercial service with as little as 45 satellites in orbit.” Commercial revenue, he said, belongs to next year, so the 2026 guide is gateways, engineering, and government work. On rides he said: “We have 10 launches booked with 2 different providers, and we’re targeting a cadence of every month or 2 on average.” He is not betting the schedule on Blue Origin. The line the bull case has to live inside is: “And with a mix of launches, we think we can get to early 2027 for our initial 45 satellites.”
June and August flew three satellites a rocket. Six monthly flights through March add 18 and land near 31, not 45. A launch every two months adds nine and lands near 22. Ten booked rides at three each are 30 spacecraft and take 10 to 20 months. Early 2027 needs fuller stacks or a faster tempo. Three-satellite flights on a six-to-eight-week clock are how the date slips.
What the carriers have actually signed
The design is wholesale. AST needs the operators to switch the array on for phones they already sell. The company timeline records a definitive agreement with AT&T, a definitive Vodafone agreement in December 2024 covering Europe and Africa through 2034, the SatCo joint venture with Vodafone, and a definitive Verizon agreement announced on October 8, 2025, with service intended to begin in 2026. Avellan said: “Through our definitive commercial agreement with Verizon, we are working to deliver space-based cellular broadband coverage from space across the continental United States.” The sentence is in the October 8, 2025 Business Wire release.
On April 23, 2026 the FCC granted AST authority for up to 248 satellites for supplemental coverage from space, on low-band spectrum held by AT&T, Verizon, and FirstNet. That release is operating authority, not a bill. The August update still treats spectrum as a target, about 100 megahertz in the United States and more than 60 globally. Testing continues with Vodafone and other operators in Europe, Canada, Japan, and Saudi Arabia. A Rakuten joint venture was preliminarily selected in Japan for up to about $1 billion of non-dilutive capital. More than 60 operator partnerships are reach, not the backlog of about $1.30 billion. Government awards above $125 million, and nearly 50 gateways, are what the 2026 guide is counting.
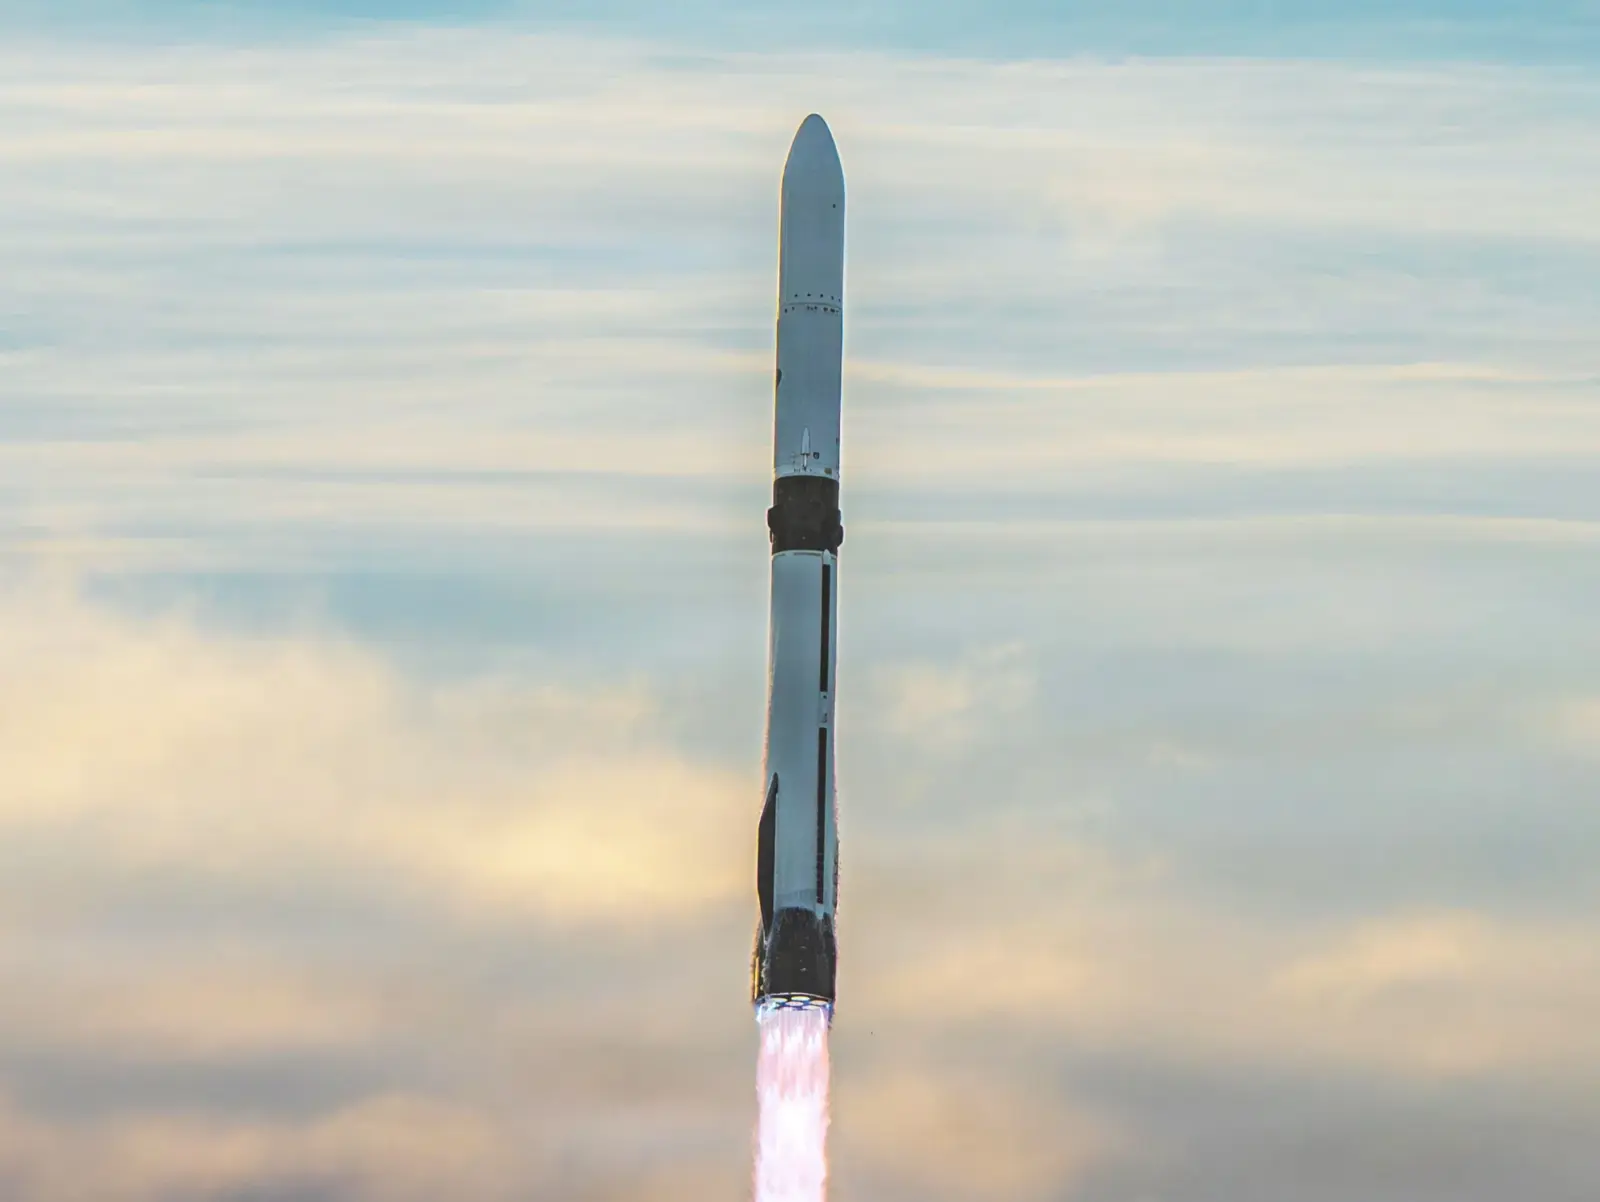
SpaceX flew the June and August missions and is building Starlink direct-to-cell. On May 12, 2026 the FCC approved EchoStar’s sale of about 65 megahertz nationwide to SpaceX for that service, in the Commission’s order. FinanceFeeds has already written about SpaceX’s plan to compete as a phone carrier, which is a different product from renting AST’s array to Verizon and AT&T. The photograph here is the April 19 New Glenn liftoff with BlueBird 7. Later birds moved to Falcon 9, so the cadence now sits with a company that also wants the phone customer.
How the $96 bull case and the $44 bear case are built
The bull case is $96, the nearest dollar to four Buy or Overweight targets. Roth Capital was at $108 on May 12, 2026, a Buy. Piper Sandler was at $98 on August 11, Overweight, cut that day from $100. Berenberg was at $92 on September 2, a Buy initiation by Michael Filatov. B. Riley was at $85 on July 17, a Buy, with Mike Crawford the analyst on that firm’s marks. The four sum to $383. Divided by four, that is $95.75, published as $96 so the headline, the address, the chart, and the table use one figure.
Deutsche Bank’s Bryan Kraft stays out of the average. On August 12 he was at Hold with a $93 target, cut from $106, and including him the five-target mean is $95.20. The other marks, Bank of America at $80, UBS analyst Christopher Schoell at $78, Barclays analyst Mathieu Robilliard at $60, and Scotiabank at $50.80, are dated in the table. MarketScreener and The Markets Daily’s MarketBeat roundup are the compilations. The unweighted average of all nine is $82.76.
| Broker | Date | Rating | Target |
|---|---|---|---|
| Roth Capital | May 12, 2026 | Buy | $108 |
| Piper Sandler | August 11, 2026 | Overweight | $98 |
| Deutsche Bank | August 12, 2026 | Hold | $93 |
| Berenberg | September 2, 2026 | Buy | $92 |
| B. Riley | July 17, 2026 | Buy | $85 |
| Bank of America | August 11, 2026 | Neutral | $80 |
| UBS | August 11, 2026 | Neutral | $78 |
| Barclays | June 8, 2026 | Underweight | $60 |
| Scotiabank | July 29, 2026 | Sector Perform | $50.80 |
At $96, 389,167,494 shares are worth $37.36 billion, 63.1% above the $22.91 billion implied by the September 30 close. That is 213.5 times the $175 million sales midpoint and 28.7 times the $1.30 billion backlog. The July convertible is still about $53 a share out of the money. It requires the fuller stacks or faster tempo already described, so the count can near 45 by early 2027. It does not require a trade through $149.20 or a return to the May 28 close of $133.09.
The bear case is $44. Nasdaq shows an intraday low of $49.31 on November 21, 2025. That session closed at $51.37, so the reference is the low. From the August 19, 2026 close of $66.43 to $58.86, the shares fell 11.4%. Multiply the November low by that ratio: $49.31 times $58.86, divided by $66.43, is $43.69, which rounds to $44 the way $95.75 rounds to $96. It is not the $46 figure used in August, and it is not paired with the old $138 bull case. The close is already $1.14 under Barclays at $60.
MarketBeat’s $86.58, cited on September 24, and StockAnalysis’s $79.61 both sit between the close and $96, and both shops call the consensus a Hold. The table converts each average into equity value and into a multiple of midpoint sales and of the backlog. This note does not blend the two samples. Seven of the nine dated targets are still above $58.86.
| Case | Price | Equity value | Versus $58.86 | Versus $175 million sales | Versus $1.30 billion backlog |
|---|---|---|---|---|---|
| Bull case | $96 | $37.36 billion | +63.1% | 213.5x | 28.7x |
| MarketBeat average, September 24 | $86.58 | $33.69 billion | +47.1% | 192.5x | 25.9x |
| StockAnalysis average | $79.61 | $30.98 billion | +35.3% | 177.0x | 23.8x |
| September 30 close | $58.86 | $22.91 billion | — | 130.9x | 17.6x |
| Bear case | $44 | $17.12 billion | -25.2% | 97.8x | 13.2x |
The risk that can actually move the multiple
Launch slip is the risk that separates $96 from $44. The BlueBird 7 insurance check does not replace the antenna. Adding 32 spacecraft by the end of March 2027, at three per rocket, takes about eleven flights, roughly one every two and a half weeks, faster than “every month or two.” The early-2027 sentence holds only if a manifest shows bigger stacks. If BlueBirds 14, 15, and 16 slip out of 2026, that window gets shorter.
A later share issue is still possible. First-half capital spending of $859 million against a revenue guide of at most $200 million means the factory is not self-funding, and the July notes add shares only above $149.20. The second-quarter update left the guide in place and the loss wider. That guide counts gateways and government work. The multiple counts whether 45 satellites show up.
Starlink direct-to-cell is the competitive risk with a date on a government document. The May grant gives SpaceX about 65 megahertz nationwide for a service that does not need AT&T or Verizon to agree. AST’s U.S. plan does. The definitive agreements reviewed for this note do not publish a consumer price or a revenue share that would turn 45 satellites into a 2027 cash-flow forecast. Until they do, $96 is a multiple on a backlog and on Buy targets, not a cash-flow model.
Two predictions, each with a cause
The next print that matters is a launch, ahead of the estimated November 9, 2026 earnings report. The July 31 company post dated the August 5 flight before liftoff. A comparable post, then a Falcon 9 that deploys three healthy satellites before year-end, would show the autumn cadence held and can carry the shares toward the compiler averages, roughly $80 to $87, without the full $96. The cause is a smaller left tail on launch risk. First-half revenue of $46.3 million still leaves the fourth quarter to carry a $150 million to $200 million year.
$44 follows if AST moves the 45-satellite date past early 2027, or loses another Block 2 spacecraft the way it lost BlueBird 7. The stock is already 56.0% under the May 28 intraday high and 19.0% under the last session of 2025. A formal slip would stale the Buy targets written against that sentence. Every regular-session close in the chart year sits above $44, so the bear case is the case in which that floor breaks.
FAQ
What is the ASTS stock price prediction?
The ASTS stock price prediction in this note is $96 on the bull case and $44 on the bear case. Both are measured from the Nasdaq regular-session close of $58.86 on September 30, 2026. The bull case rounds the average of four standing Buy or Overweight targets. The bear case applies the decline since August 19, 2026 to the November 21, 2025 intraday low. Launch throughput through early 2027 decides which path is the live one.
Which AST SpaceMobile close is this forecast using?
The forecast uses the Nasdaq regular-session close on September 30, 2026, which was $58.86. The shares opened at $59.91, traded as high as $62.98 and as low as $58.74, and volume was 11.9 million shares. StockAnalysis, MarketWatch, and Morningstar show the same close. After-hours and pre-market prints from October 1 are not in either case. The one-year chart behind the cases ends on that same close.
How many AST SpaceMobile satellites are in orbit?
On August 10, 2026 the company said the network had grown to 13 spacecraft, with about 20,000 square feet of combined aperture, after BlueBirds 11, 12, and 13 reached orbit on August 5. BlueBird 7, launched on New Glenn on April 19, 2026, was deorbited after an off-nominal insertion and is not in the operating set. BlueBirds 14, 15, and 16 had not launched as of that August update. The company said they were ready to ship shortly.
What would have to happen for the $96 bull case?
The $96 bull case is the rounded average of Roth Capital at $108, Piper Sandler at $98, Berenberg at $92, and B. Riley at $85. It requires the booked launch mix to do what Scott Wisniewski said it could: about 45 BlueBirds in orbit by early 2027, without relying on Blue Origin. At $96 the fully exchanged equity value is $37.36 billion, 213.5 times the midpoint of 2026 sales guidance. The July notes stay out of the money.
Why is the bear case $44 rather than the cash value?
The bear case is not a liquidation price. June 30 cash and restricted cash were $2.72 billion, about $7.00 a fully exchanged share, and pro forma cash above $3.7 billion is about $9.51 a share. $44 starts from the November 21, 2025 intraday low of $49.31, times the September 30 close divided by the August 19 close. That product is $43.69, rounded to $44. At $44 the equity would still be about $17.12 billion.
{“@context”:”https://schema.org”,”@type”:”FAQPage”,”mainEntity”:[{“@type”:”Question”,”name”:”What is the ASTS stock price prediction?”,”acceptedAnswer”:{“@type”:”Answer”,”text”:”The ASTS stock price prediction in this note is $96 on the bull case and $44 on the bear case. Both are measured from the Nasdaq regular-session close of $58.86 on September 30, 2026. The bull case rounds the average of four standing Buy or Overweight targets. The bear case applies the decline since August 19, 2026 to the November 21, 2025 intraday low. Launch throughput through early 2027 decides which path is the live one.”}},{“@type”:”Question”,”name”:”Which AST SpaceMobile close is this forecast using?”,”acceptedAnswer”:{“@type”:”Answer”,”text”:”The forecast uses the Nasdaq regular-session close on September 30, 2026, which was $58.86. The shares opened at $59.91, traded as high as $62.98 and as low as $58.74, and volume was 11.9 million shares. StockAnalysis, MarketWatch, and Morningstar show the same close. After-hours and pre-market prints from October 1 are not in either case. The one-year chart behind the cases ends on that same close.”}},{“@type”:”Question”,”name”:”How many AST SpaceMobile satellites are in orbit?”,”acceptedAnswer”:{“@type”:”Answer”,”text”:”On August 10, 2026 the company said the network had grown to 13 spacecraft, with about 20,000 square feet of combined aperture, after BlueBirds 11, 12, and 13 reached orbit on August 5. BlueBird 7, launched on New Glenn on April 19, 2026, was deorbited after an off-nominal insertion and is not in the operating set. BlueBirds 14, 15, and 16 had not launched as of that August update. The company said they were ready to ship shortly.”}},{“@type”:”Question”,”name”:”What would have to happen for the $96 bull case?”,”acceptedAnswer”:{“@type”:”Answer”,”text”:”The $96 bull case is the rounded average of Roth Capital at $108, Piper Sandler at $98, Berenberg at $92, and B. Riley at $85. It requires the booked launch mix to do what Scott Wisniewski said it could: about 45 BlueBirds in orbit by early 2027, without relying on Blue Origin. At $96 the fully exchanged equity value is $37.36 billion, 213.5 times the midpoint of 2026 sales guidance. The July notes stay out of the money.”}},{“@type”:”Question”,”name”:”Why is the bear case $44 rather than the cash value?”,”acceptedAnswer”:{“@type”:”Answer”,”text”:”The bear case is not a liquidation price. June 30 cash and restricted cash were $2.72 billion, about $7.00 a fully exchanged share, and pro forma cash above $3.7 billion is about $9.51 a share. $44 starts from the November 21, 2025 intraday low of $49.31, times the September 30 close divided by the August 19 close. That product is $43.69, rounded to $44. At $44 the equity would still be about $17.12 billion.”}}]}